Summary
Deploying an Azure Function App on the Flex plan and attempting a deployment that writes blocks to a storage account can fail with the error: “Failed to upload the block to storage account: key based authentication is not permitted.” This article explains the root cause and provides a concise, repeatable solution so you can fix deployments quickly and reliably.
Problem
When deploying to a Function App on the Flex plan, deployments that rely on storage account key authentication are blocked. The deployment attempt fails with an error indicating key‑based authentication is not permitted. The Function App therefore cannot upload deployment blocks to the storage account and deployment aborts.
You will get the following dialog box upon deploying from Visual Studio. Also you can see various logs as shown below

| Publish has encountered an error. Publish has encountered an error. We were unable to determine the cause of the error. Check the output log for more details. A diagnostic log has been written to the following location: “C:\Users\pankajsurti\AppData\Local\Temp\tmp21DA.tmp” |
| Severity Code Description Project File Line Suppression State Error OneDeploy attempt to publish file ‘C:\SRC\test-scott\FunctionApp-take-2\obj\Release\net9.0\linux-x64\PubTmp\FunctionApp-take-2-20251030110306149.zip’ through ‘https://test-scott-func-app.scm.azurewebsites.net/api/publish?RemoteBuild=false‘ failed with status code ‘Failed’. See the logs at ‘https://test-scott-func-app.scm.azurewebsites.net/api/deployments/2031fb90-ef08-442c-9c50-bb2b3c8ba581/log‘. FunctionApp-take-2 C:\Program Files\dotnet\sdk\9.0.306\Sdks\Microsoft.NET.Sdk.Publish\targets\PublishTargets\Microsoft.NET.Sdk.Publish.OneDeploy.targets 58 |
| [{“log_time”:”2025-10-30T16:03:08.2164165Z”,”id”:”2031fb90-ef08-442c-9c50-bb2b3c8ba581″,”message”:”Starting deployment pipeline.”,”type”:0},{“log_time”:”2025-10-30T16:03:08.2341004Z”,”id”:”2031fb90-ef08-442c-9c50-bb2b3c8ba581″,”message”:”[Kudu-SourcePackageUriDownloadStep] Skipping download. Zip package is present at /tmp/zipdeploy/2031fb90-ef08-442c-9c50-bb2b3c8ba581.zip”,”type”:0},{“log_time”:”2025-10-30T16:03:08.2359905Z”,”id”:”2031fb90-ef08-442c-9c50-bb2b3c8ba581″,”message”:”[Kudu-ValidationStep] starting.”,”type”:0},{“log_time”:”2025-10-30T16:03:08.2552982Z”,”id”:”2031fb90-ef08-442c-9c50-bb2b3c8ba581″,”message”:”[StorageAccessibleCheck] Error while checking access to storage account using Kudu.Legion.Core.Storage.BlobContainerStorage: BlobUploadFailedException: Failed to upload blob to storage account: Response status code does not indicate success: 403 (This request is not authorized to perform this operation.).”,”type”:2},{“log_time”:”2025-10-30T16:03:08.259516Z”,”id”:”2031fb90-ef08-442c-9c50-bb2b3c8ba581″,”message”:”InaccessibleStorageException: Failed to access storage account for deployment: BlobUploadFailedException: Failed to upload blob to storage account: Response status code does not indicate success: 403 (This request is not authorized to perform this operation.).”,”type”:2}] |
| Key based authentication is not permitted on this storage account. RequestId:296de81a-401e-00a7-6026-494217000000 Time:2025-10-29T22:53:45.5896635Z Status: 403 (Key based authentication is not permitted on this storage account.) ErrorCode: KeyBasedAuthenticationNotPermitted Content: <?xml version=”1.0″ encoding=”utf-8″?><Error><Code>KeyBasedAuthenticationNotPermitted</Code><Message>Key based authentication is not permitted on this storage account. RequestId:296de81a-401e-00a7-6026-494217000000 Time:2025-10-29T22:53:45.5896635Z</Message></Error> Headers: Server: Microsoft-HTTPAPI/2.0 x-ms-request-id: 296de81a-401e-00a7-6026-494217000000 x-ms-error-code: KeyBasedAuthenticationNotPermitted Date: Wed, 29 Oct 2025 22:53:44 GMT Content-Length: 269 Content-Type: application/xml |
Root cause
- Flex plan Function Apps are not allowed to use storage account key authentication for uploads.
- The Function App (or your deployment process) was configured to use the storage account connection string or key-based access.
- The deployment must instead authenticate to the storage account using Azure Active Directory identities assigned to the Function App.
Solution overview
Switch the deployment to use a managed identity (system-assigned or user-assigned) and grant that identity the required role “Storage Blob Data Contributor” on the target storage account. Update the Function App deployment settings to use the managed identity for storage access instead of key/connection string authentication.
Step by step fix
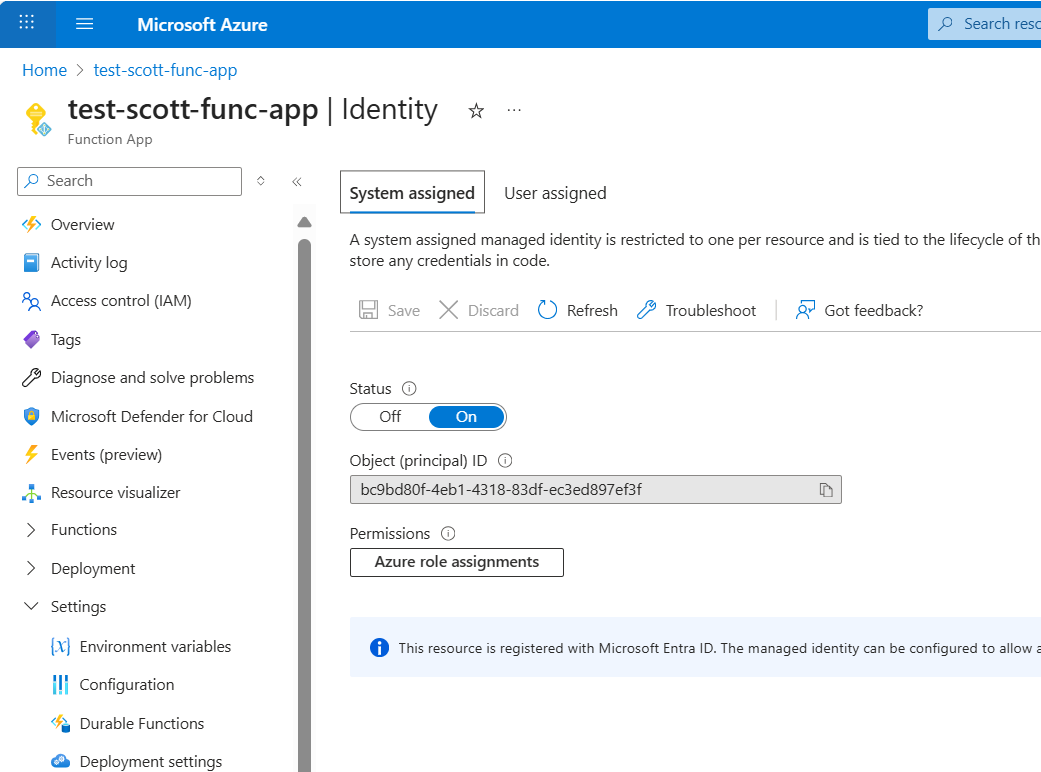
- Enable a managed identity on the Function App
- Open the Function App in the Azure portal and go to Identity.
- Turn on System assigned identity (or create/use a User assigned identity if you prefer).
- Copy the identity’s GUID (principal ID) for convenience.
- Assign a role on the storage account
- Open the target Storage Account and go to Access control (IAM).
- Click Add role assignment.
- Assign the role Storage Blob Data Contributor to the Function App identity by pasting/selecting the principal ID or selecting the Function App/user-assigned identity.
- Do not assign broader roles than needed; Storage Blob Data Contributor is sufficient for upload operations.

- Update Function App deployment settings
- In the Function App, go to Deployment Center or Deployment settings.
- Change the storage access method from connection string / key-based (default) to Use managed identity (select system-assigned or the user-assigned identity you enabled).
- Save the deployment configuration.

- Remove unnecessary permissions
- Remove any unnecessary roles previously granted (for example, Account Contributor or Blob Data Owner), keeping permissions minimal and scoped to the storage account and the upload task.
- Re-run deployment
- Redeploy your Function App (via your CI/CD pipeline, PowerShell, or portal) and confirm that uploads succeed without the key-based authentication error.
Verification checklist
- Managed identity enabled on the Function App and the correct principal ID visible.
- Storage Blob Data Contributor role assigned to that identity on the storage account.
- Deployment settings in the Function App configured to use the managed identity for storage access.
- Successful deployment without the earlier key-based authentication error.
Best practices and notes
- Use least privilege: the Blob Data Contributor role is typically sufficient for block uploads; avoid Owner or higher-level roles.
- Prefer user-assigned identities if you want to reuse the same identity across multiple apps and scripts.
- If you automate deployments (ARM, Bicep, Terraform, PowerShell), ensure the deployment template sets the Function App deployment settings to use the managed identity rather than connection strings.
- Avoid adding your own account as a workaround for automation; ensure automation runs using the assigned managed identity for production safety and auditability.
Conclusion
The “Storage key based authentication is not permitted” error on Flex plan Function Apps is caused by attempting storage uploads with key/connection string authentication. The reliable fix is to enable a managed identity for the Function App, grant it the Storage Blob Data Contributor role on the storage account, and update the Function App deployment settings to use the managed identity. Follow the steps above and you should be able to deploy successfully without changing storage keys or weakening access control.